by urbandata | Mar 1, 2014 |
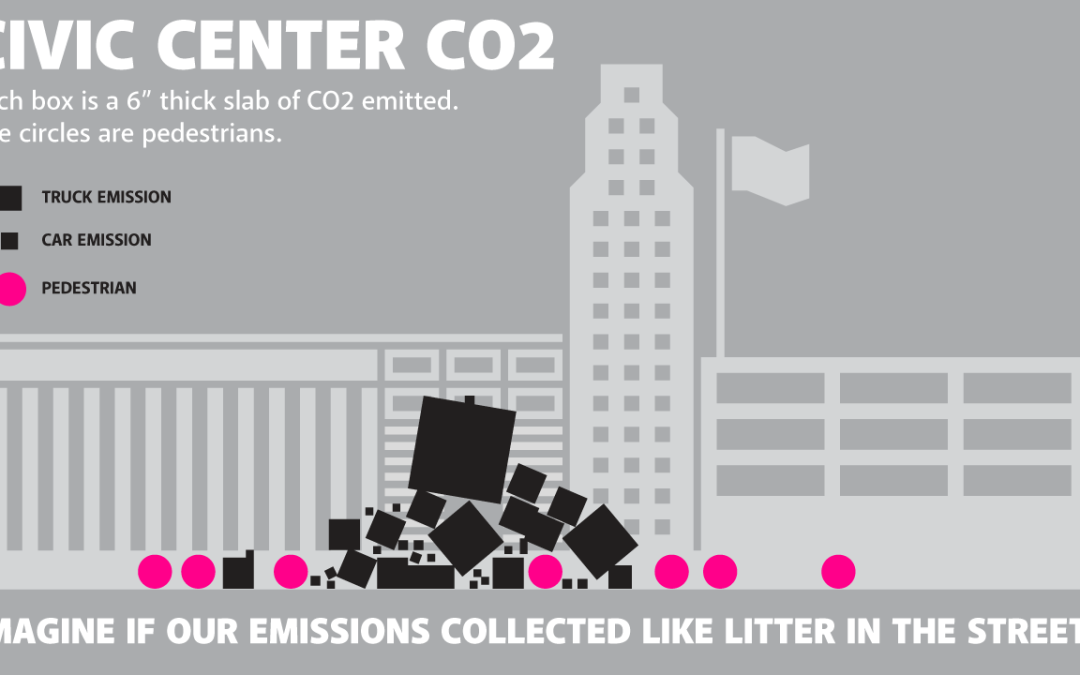
1st Place + Urban Digital Displays February 2014 Project Description Imagine if you could experience the C02 emissions as a tangible obstruction in the street. The goal of this visualization is to inspire people to take an interest in the invisible pollution that surrounds them every day along the Market Street corrodor. From there, future versions of the interface will educate them about the impact of the C02 and what they can do to help reduce it. Project Team Johan Lindegaard, Erik Van der Molen, Reza Ali, Jasper...
by urbandata | Mar 1, 2014 |
3rd Place + Urban Digital Displays Hackathon February 2014 Project Description Different modes of transit are visualized as the sum of their emissions. Through camera vision the project would detect its surrounding pedestrians and vehicles and overlay a graph which shows its environmental impact. Project Team Karen Marcelo, Eric Socolofsky, Jesse Day, Scott Kildall, Kristin Henry Project Link Urban Data Challenge Hackathon (Data Viz) from Scott Kildall on Vimeo. Urban Data Challenge Hackathon (Animation) from Scott Kildall on...
by urbandata | Mar 1, 2014 |
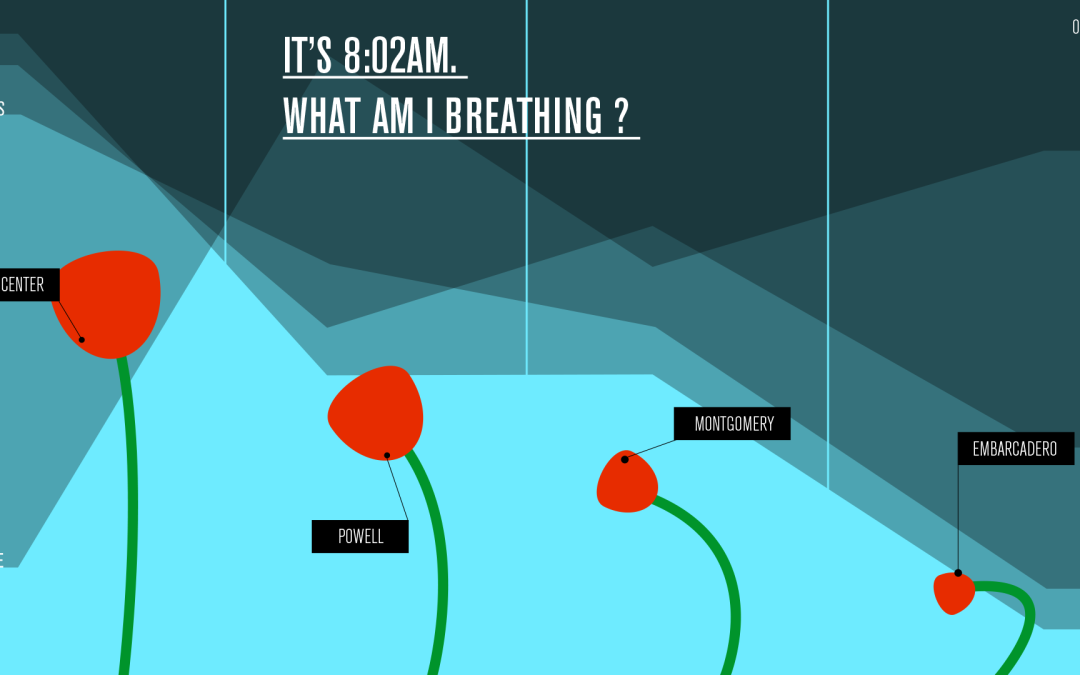
3rd Place + Urban Digital Displays Hackathon February 2014 How do you give people a reason to care about two weeks of pollution data on Market St. in San Francisco? Our answer was simple. Flowers. We interpreted the pollution data into actual pollution that effects our flowers in real time. Each flower represents a major intersection on Market St. The flowers live and die as pollution increases or disappears. Project Link http://cargocollective.com/UrbanDataCanvas Project Team Ed Kahler, Boriana Viljoen, Alex...