DIY Sensor Network Deployment
December 2014 – February 2015
Deploy Your Sensor
SENSOR HOST REQUIREMENTS
- You will need to provide power and a stable WIFI connection for the duration of the project – the sensor itself has a very low footprint and uses very little bandwidth and electricity.
- The sensor kit needs to be placed outdoors in a safe and stable environment (porch, window ledge, garden, balcony, roof).
- The sensor case is waterproof but a sheltered location is preferred.
- You don’t need to be a professional engineer or hacker to assemble the kit. We will provide you with instructions and we will inform you about build workshops hosted in your city.
- To get the most out of the project, please be committed: install the sensor as soon as you receive it; data needs to come in by mid-Jan 2015.
- Maintain and check the sensor for the duration of 3 months. We will monitor the data streams but please be proactive and engaged if there are any issues.
- Do not change the location of the sensor once it’s installed to ensure as much data accuracy as possible.
We need documentation: send us comments, photos, videos of your installation, the location, and ongoing experience, that we can share from around the world. - We encourage you to be creative. Let your sensor tell a story. The best engagement will be included in our interactive map so that you can be inspired and inspire others.
Hardware and Resources
- Seeduino Cloud
- Base Shield V2
- Grove - Dust Sensor
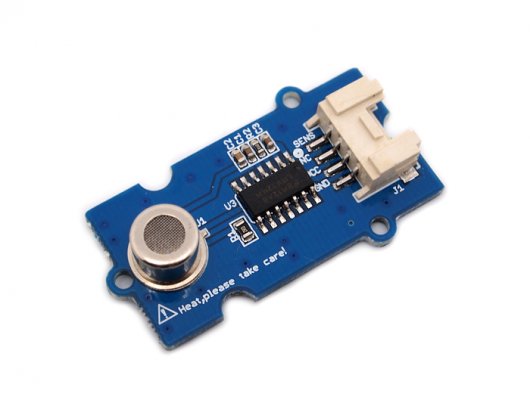
- Grove - Air Quality Sensor
- Grove - Sound Sensor
- Grove - Digital Light Sensor
- Grove – Temperature & Humidity Sensor Pro
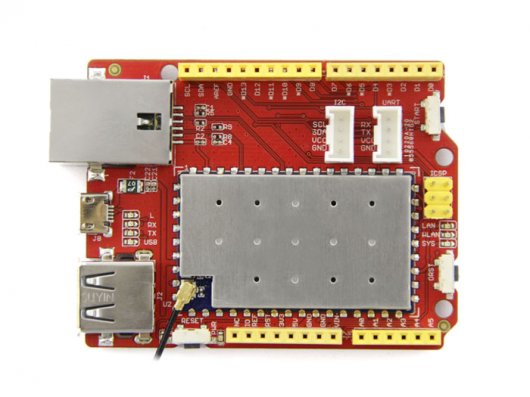 Seeeduino Cloud is a microcontroller board based on Dragino WiFi IoT module HE and ATmega32u4. HE is a high performance, low cost 150M, 2.4G WiFi module which means “core” in Chinese and with an Open Source OpenWrt system inside. Seeeduino Cloud is also an Arduino compatible board, 100% compatible to grove, shield and IDEs(>=1.5.3). Except for the normal interface of Arduino, Seeeduino Cloud has built-in Ethernet and WiFi support, a USB-A port which makes it very suitable for those prototype design that need network connection and mass storage. It is also a good idea to make Seeeduino Cloud to be an IoT gateway. HE module:
Features of Seeeduino Cloud:
- Compatible with Arduino Yun
- Based on Dragino WiFi IoT module HE
- Open Source OpenWrt system inside
- Support 2.4Ghz WiFi, 802.11 b/g/n
- Support Ethernet
- Support USB 2.0
- Size: 75.10mm x 53.39mm x 11.50mm / 2.95″ x 2.10 x 0.45″
- Working temperature: -20~60°C
- Surface colors: Red
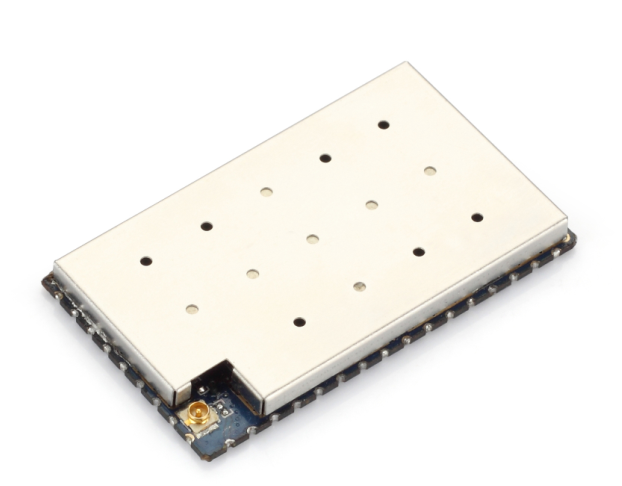
Features of HE module:
- CPU: ATHEROS AR9331 chipset, which integrates MIPS 24Kc processor, CPU 400MHz, Switch (MAC,PHY) and integrates with MAC, RF, PA and LNA for WiFi.
- RAM : 64MB;
- Flash : 16MB
- Interfaces: 2 x RJ45, 1 x USB Host, 1 x UART, 14 multiplex GPIOs
- OS: Open Source OpenWrt
- Power: 3.3v power input
- WiFi: Support 150M 2.4Ghz WiFi, 802.11 b/g/n
- Frequency range: 2.4~2.4835GHz
- Modulation: BPSK, QPSK, CCK and OFDM (BPSK/QPSK/16-QAM/ 64-QAM)
- Sensitivity @PER : 135M : -65dBm@10%PER; 65M : -65dBm@10%PER; 54M : -68dBm@10%PER; 11M : -84dBm@8% PER; 6M : -88dBm@10% PER; 1M : -90dBm@8% PER
- Typical Distance: Indoor: 60m (max); Outdoor 150m (max) (with 2 dBi antenna)
- RF Power: 11n: 13dBm; 11g: 13-15dBm, 11b: 16-18dBm,
- Connector: I-PEX connector. Provide Optional ANT pin out for SMT
Resources:
- Wiki: http://www.seeedstudio.com/wiki/Seeeduino_Cloud
- Schematic:http://www.seeedstudio.com/wiki/File:Seeeduino_Cloud_PDF.pdf
- Latest Firmware: http://www.seeedstudio.com/wiki/File:Seeed-build–v1.3.4–20140815-1100.zip
- Link of the “HE” Core module: http://www.dragino.com/products/linux-module/item/87-he.html Note: You can also refer to the documentations of Arduino Yun as they’re commonly forked from the Linino branch of OpenWrt OS.
- Datasheet for HE: http://www.dragino.com/downloads/index.php?dir=datasheet/&file=HE%20WiFi%20IoT%20Module%20datasheet.pdf
- Link of Arduino Yun: http://arduino.cc/en/Main/ArduinoBoardYun?from=Main.ArduinoYUN
Tips:
- How to reset Arduino side (32U4) without resetting the whole board?
Press the button with overlay "RESET" aside. - How to reset the MIPS side?
Press the button with overlay "ORST" aside. - How to restore the WiFi setting to factory default?
Press the button with overlay "START" over 5 seconds (less than 30 seconds) and then release. - How can I make the seeeduino cloud connect to another WiFi router?
  You need to press the "START" button over 5 seconds to clear the previous WiFi
  settings, then power cycle the Seeeduino Cloud. Use your laptop to search the WiFi
   SSID named "Seeeduino-Cloud-xxxx", then join that SSID. Open the web browser, goto
   "192.168.240.1", then you will see the Seeeduino Cloud WEB GUI web page. Default
   password is "seeeduino".
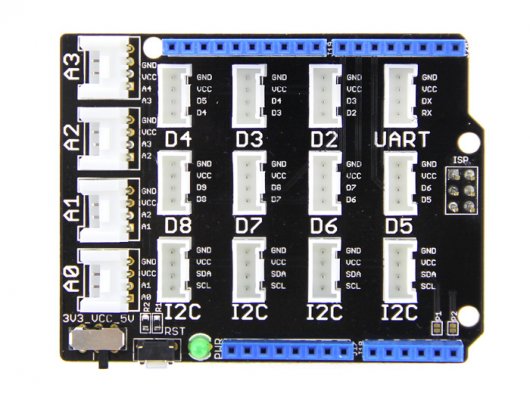 As an expansion board, Base Shield v2 has many Grove connectors, making it convenient for you to use Grove products together. And It is compatible with a series of Arduino products. Power Compatible: Every Grove connector has four wires, one of which is Vcc. However, not every micro-controller main board needs a supply voltage of 5V, some need 3.3V. That’s why we add a power switch to Base Shield v2. In this way, you can adjust the voltage of Vcc via this switch, making sure the voltage of Vcc is the same as supply power of the main board.
Resources:
- Wiki page: http://www.seeedstudio.com/wiki/Base_shield_v2
- Schematic: http://www.seeedstudio.com/wiki/File:Base_Shield_v2.zip
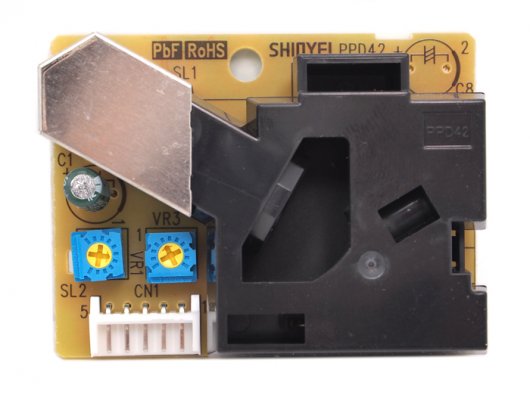
Dust Sensor is to create Digital (Lo Pulse) output to Particulate Matters (PM). Lo Pulse Occupancy time (LPO time) is in proportion to PM concentration. The output is for PM whose size is around 1 micro meter or larger. We can use the sensor to detect the dust in clean room.
Features:
- Grove compatible interface(extra wire with connecter)
- Supply voltage range: 5V
- Minimum detect particle: 1um
- PWM output
- Dimensions: 59(W)x45(H)x22(D) [mm]
Resources:
- Wiki page: http://www.seeedstudio.com/wiki/Grove–Dust_sensor
- Datasheet: http://www.seeedstudio.com/wiki/images/4/4c/Grove–Dust_sensor.pdf
- Example 1: https://github.com/Seeed-Studio/TravellingMine
- Example 2: https://github.com/Seeed-Studio/Air_Quality_Test_Box
- Example 3: https://github.com/Seeed-Studio/Grove_Dust_Sensor
Resources:
- Wiki page: http://www.seeedstudio.com/wiki/Grove_-_Air_Quality_Sensor
- Sensor Datasheet: http://www.seeedstudio.com/wiki/File:TP-401A_Indoor_Air_quality_gas_sensor.pdf
- Schematic:http://www.seeedstudio.com/wiki/File:Air_quality_sensor_schematic.pdf
- Example 1: https://github.com/Seeed-Studio/TravellingMine
- Example 2: https://github.com/Seeed-Studio/Grove_Air_quality_Sensor
- Example 3: https://github.com/Seeed-Studio/Air_Quality_Test_Box
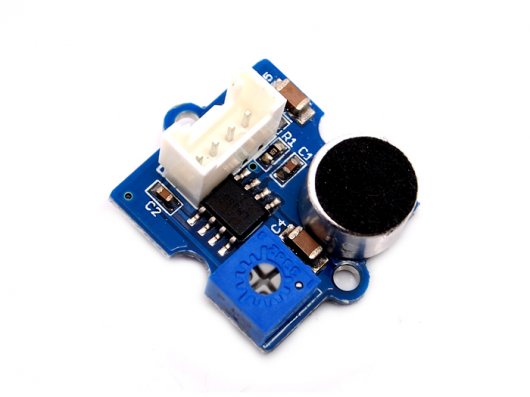
The Sound sensor module is a simple microphone. Based on the power amplifier LM386 and the electret microphone, it can be used to detect the sound strength of the environment. The value of output can be adjusted by the potentiometer.
Features:
- Grove compatible interface
- Wide supply voltage range: 4V-12V
- Low quiescent current drain: 4mA
- 2.0cm x 2.0cm twig module
- Minimum external parts
- Gain adjustable
Resources:
- Wiki: http://www.seeedstudio.com/wiki/index.php?title=Twig–Sound_Sensor
- Schematic: http://www.seeedstudio.com/wiki/images/e/e6/Grove–Sound_Sensor_v1.pdf
- Eagle file: http://www.seeedstudio.com/wiki/File:Grove–Sound_Sensor_v1.3_eagle.zip%E2%80%8E
- Datasheet: http://garden.seeedstudio.com/images/a/ae/LM386.pdf
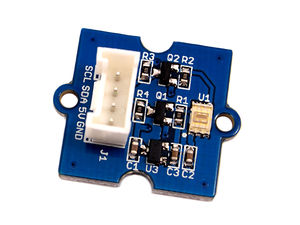
This module is based on the I2C light-to-digital converter TSL2561 to transform light intensity to a digital signal. Different from traditional analog light sensor, as Grove – Light Sensor, this digital module features a selectable light spectrum range due to its dual light sensitive diodes: infrared and full spectrum. You can switch between three detection modes to take your readings. They are infrared mode, full spectrum and human visible mode. When running under the human visible mode, this sensor will give you readings just close to your eye feelings.
Features:
- Selectable detection modes
- high resolution 16-Bit digital output at 400 kHz I2C Fast-Mode
- Wide dynamic range: 0.1 – 40,000 LUX
- Wide operating temperature range: -40°C to 85°C
- Programmable interrupt function with User-Defined Upper and lower threshold settings
Resources:
- Wiki page: http://www.seeedstudio.com/wiki/Grove–Digital_Light_Sensor
- Library: https://github.com/Seeed-Studio/Grove_Digital_Light_Sensor
- Schematic pdf:http://www.seeedstudio.com/wiki/File:Digital_light_sensor.pdf
- Eagle file:http://www.seeedstudio.com/wiki/File:Digital_light_sensor_eagle_file.zip
- TSL2561 datasheet: http://www.seeedstudio.com/wiki/File:TSL2561T.pdf
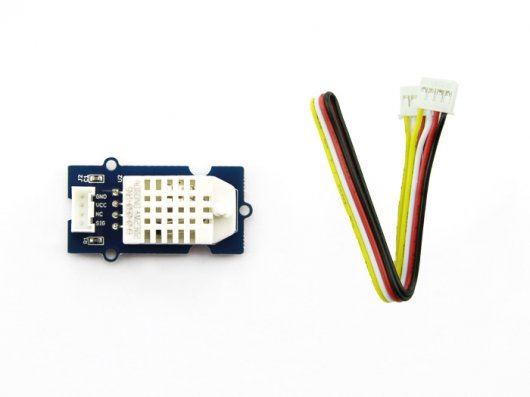
This product is a high accuracy temperature and humidity sensor used in home conditions. It consists of a capacitive sensor element used for measuring relative humidity and a negative temperature coefficient (NTC) thermistor used for measuring temperature. Every sensor was calibrated in an accurate humidity room. Small dimension, ultra low power consumption, more than 20m’s signal transmission distance make it a good selection for various application environment. Different from Twig – Temp&Humi Sensor v0.9b, the accuracy of this module can gets up to 0.3 degree in temperature and 2% in relative humidity.
Resources:
- Wiki: http://www.seeedstudio.com/wiki/Grove–Temperature_and_Humidity_Sensor_Pro
- Library: https://github.com/Seeed-Studio/Grove_Temper_Humidity_TH02
- Eagle file:http://www.seeedstudio.com/wiki/File:Temp_Humi_Pro_eagle_files.zip
- Datasheet for TH02: http://www.hoperf.cn/upload/sensor/TH02_V1.1.pdf
FAQ
Why do the timestamps my sensor sends out not match my local time?
This is normal, all sensors use UNIX time, a time encoding format which allows us not to worry about time zones. You can convert from UNIX time to your local time using an online converter. When you look at the webpage with your data points, the latest posted data is at the bottom of the page.
Has my sensor stopped emitting data?
If you think it hasn’t changed in a while, try adding one or two 0s at the end of the URL in your browser: change “..count=10000” to “..count=1000000”. This changes the total number of entries displayed on the page. If it still doesn’t add new entries at the bottom, verify that your sensor is still turned on and plugged in properly.
How can I display the most recently posted data?
To display your data feed in reverse chronological order, go to the following link in your browser, make sure to insert your client ID where necessary. You can always modify the startIndex value and count value to display a specifiedhttps://localdata-sensors.herokuapp.com/api/v1/sources/INSERT-CLIENT-ID-HERE/entries?startIndex=0&count=5&sort=desc
Why doesn’t the temperature sensor match with the actual exact temperature around it?
The temperature sensor is inside the box, close to a few heating electronics and therefore won’t be as reliable as a standalone device completely exposed to the air. However, the variations should reflect the surrounding temperature changes properly.
What is a good spot to hang my sensor?
The more activity the better, hang it above the street, instead of your garden, if you can. This will allow us to tell a more interesting story. Make sure your sensor is safe from harsh weather conditions, it is best to hang it under a ledge or roof where it won’t get rained on.
Why do some of the data entries indicate “WarmUp”?
The air quality sensor contains a heating element that has to warm up before it can accurately output data. Give the sensor a few minutes to actually warm up, it will soon start to transmit a proper measurement.
It seems like my sensor doesn’t transmit all the different metrics (i.e. all 7 of them)?
There might be a problem with the communication between the Seeeduino and the individual sensors, try verifying that they are all hooked up properly, no need to force it.
Is the black cable to the antenna from the seeeduino board too short?
It is indeed shorter than shown in the tutorial, you probably wont be able to paste it on the outside of the box. But since it is a receiver for electromagnetic signals, any wall inside the box will do.
Where is the port called “/dev/tty.usbmodemXXXX (Arduino Yún)”?
Make sure your sensor is plugged in your computer via USB before selecting the port. If you are using a windows computer to configure your sensor, the port you have to select is COMx, x being a number.
Why can’t I log into the sensor after configuring and going back to my own wifi?
Some people can’t log back to their sensor, the exact cause of this is unknown. You can still configure your sensor though. Simply follow the next steps in the tutorial.
Why does the serial monitor say that the sensor can’t connect to the internet?
If you can’t connect to the web interface as in question 10. your sensor will print this text in the serial monitor. However, if you wait for an additional 10-20 minutes the data should start to be uploaded. Keep an eye on your data URL.
Data Canvas: Sense Your City is presented by