A City’s Heartbeat
Third Prize
$300 cash
“A City’s Heartbeat” is a web-based interactive visualization using Geneva’s transportation dataset.
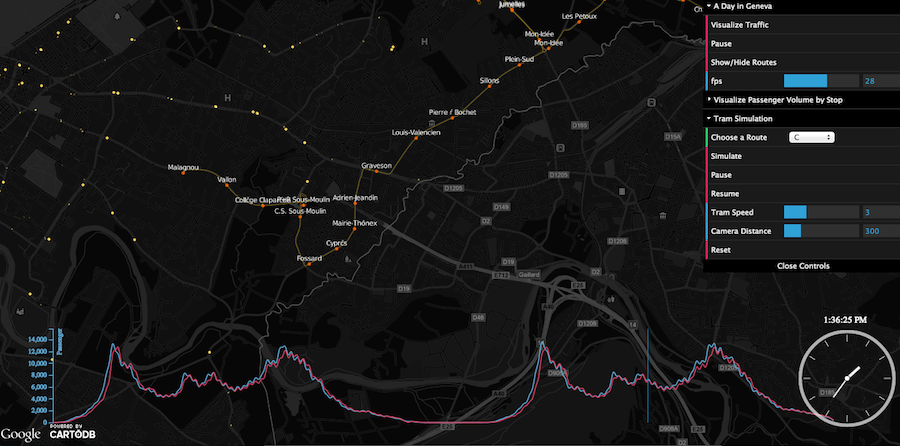
This project has three main features. Firstly, we transformed the transportation dataset into a data cube format, which allows us to render big, time series data in the client. A playback of tram movements over a 2 day period allows us to “feel the pulse” of the city.
Feature two aims to visualize the volume of passengers over time. By using CSS 3, we utilised 2½ dimension to illustrate the passenger volume in each tram station. A complimentary D3.js line graph plots the overall passenger volume for the entire city. This visualization is our interpretation of the city’s “blood pressure”.
In the third feature, we bring users into the 3rd Dimension by taking them on a tour of the real Geneva city’s tram routes. Users will experience the journey through a realistic 3D environment, and be able to see what is around the tram route. We believe this visualization adds additional meaning and context to the previous two parts.
Project Link
Project Team