Urban Bus Races
Third Prize
$300 cash
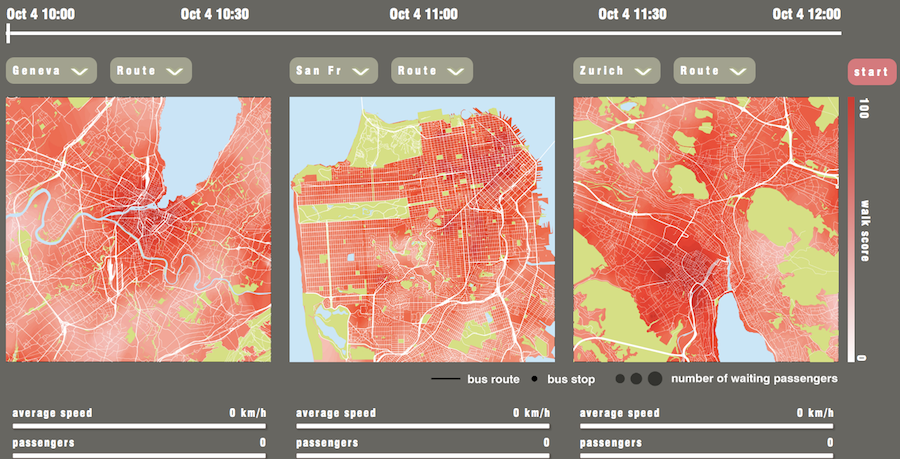
Powered by transit data from San Francisco, Zurich and Geneva, Urban Bus Races is an interactive tool that allows users to visualize, measure, and compare bus route performance using actual transit data.
Urban Bus Races indicates the location of buses operating on the routes selected, during the date and hour selected (local time). The size of the grey circles along the routes represent the number of passengers waiting at the stop. When a bus, represented by a small white circle, arrives at a stop, all waiting passengers board the bus and the grey circle shrinks to show that the passenger queue has been served. This allows users to quickly visualize areas of the city where large queues are forming, by time of day. Large queues may be an indication that reliability needs to be improved to reduce gaps between buses or that service frequencies need to be increased to satisfy demand. The background maps are color-graduated according to the corresponding Walk Score®, to highlight areas of the city with more accessible destinations within walking distance of a transit stop.
Project Link
Project Team
Ben Juhn
Jed Horne
Nicole Foletta
Laura Shifley