Selected for Exhibition
DataCanvas Weather Timelapse is eligible for Data Canvas exhibitions that will be curated both online and offline.
Project Description
Lying on a greenfield, surrounded by dandelion, watching the sky. Clouds are forming, reshaping, passing by. As scientists we are wondering what causes the clouds, the rain, and all those weather-related phenomena. What if we could keep a longer observation somehow recorded, in order to study the complex interaction between several parameters as there are wind speed and direction, temperature, radiation, precipitation, pollution etc. in a scientific manner? What would be needed to do so? Data Canvas is enabling half of the answer by providing sensors for climate data and a platform to host the measurements. The missing part was our project on weather timelapse videos.
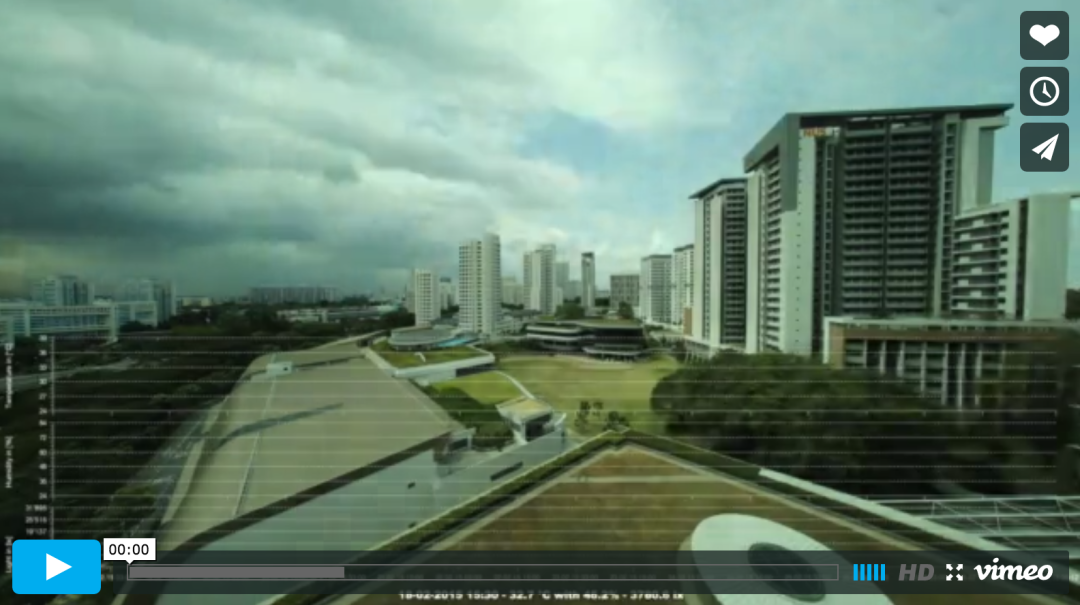
A Canon EOS M equipped with a F2.8/8mm fisheye lens and customized firmware has been installed to record a timelapse video. Based on one picture per minute in variable exposure and shutter time either a 30fps or a 60fps video can be compiled. With the latest memory cards up to two weeks of observation can be captured. The camera is mounted on a tripod, has a weather-proof casing and can run independently from the user. Currently we record a 120° field of view with a single camera in 4k video resolution; in near future we have a setup of three cameras plus the weather sensor to record the full 360°.
Data from the Data Canvas platform (our own team’s sensor) is now put an overlay on top of the weather timelapse video. By comparing temperature, humidity, and sunlight the scientist or basically any weather-interested person can study how clouds form and in which way the built environment (though heat storage, anthropogenic heat, and different albedo & evapotranspiration) influences the local climate. In this way we open the field of weather studies to all kinds of stakeholders, truly enabling citizen science and crowdsourcing.
Another feature of our weather timelapse project is interactivity. The video on vimeo is an amazing but only static representation; coding the data overlay in Java FX allows the user to select what kind of data to be displayed, the style and layout. Prior to the data overlay and the video are of course the raw images. Our team member Jonas developed an automated routine where the user specifies the data path and the image path, the fps and desired time window (e.g. March 12 12pm to March 19 12pm). The dialogue computes the video clip length, starts the rectifying (fisheye) process and finally compresses the video to 4k or 2k with the desired codec. Since the maximum operation time of the camera setup is around two weeks, over 20’000 images have to be handled, which takes some time (far from real time, but doable within a day on a decent machine). Limitations in Java FX for the playback are now the only bottleneck left, but we are confident that the recent introduction of 4k and beyond screens the codecs will evolve equally.
Created Jonas Lauener + Matthias Berger | Future Cities Lab (Singapore)
Jonas and Matthias both work at Future Cities Lab, the ETH outpost in Singapore, which hosted one of the Sense Your City nodes.