Selected for Exhibition
City Dots is eligible for Data Canvas exhibitions that will be curated both online and offline.
Project Description
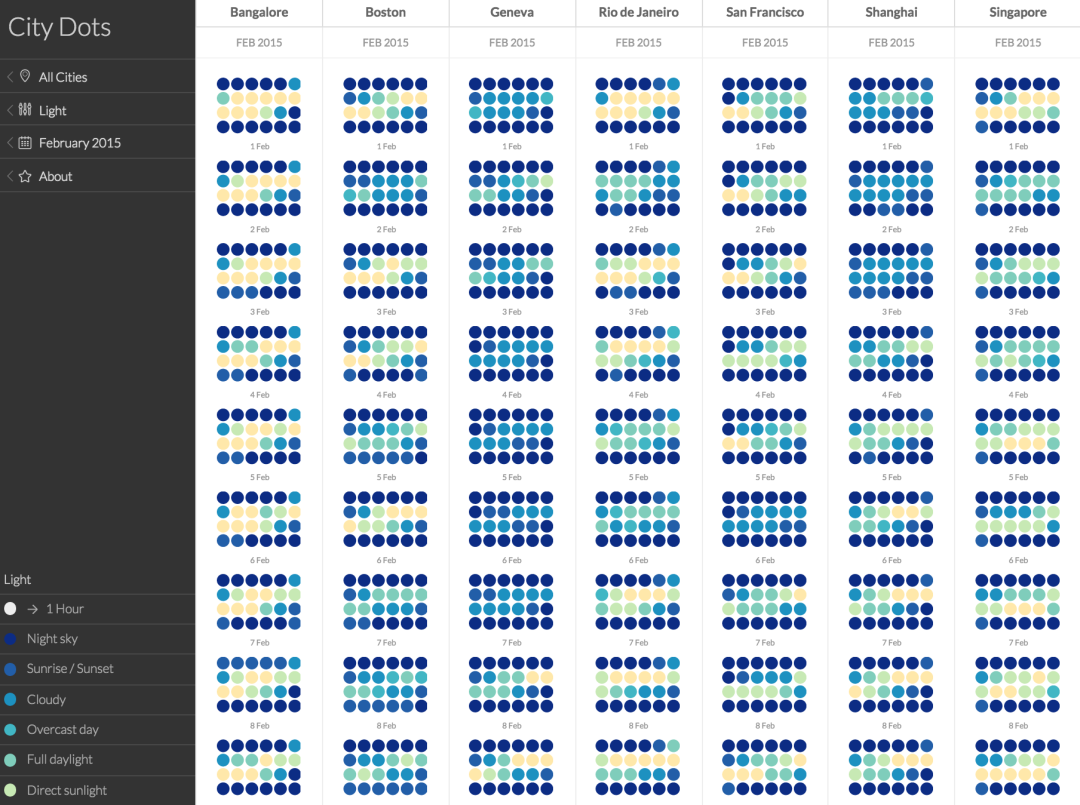
City Dots allows you to explore, compare and sense the patterns of your city.
The interactive infographic visualizes data from various sensors deployed in 7 cities around the globe.
The aggregated data for each city is plotted as a collection of dots at a resolution of 1 hour. Each dot represent one hour of sensor data. 24 dots represent a single day.
The Dotty Small Multiples allow the comparative visual display of multivariable data that would otherwise be difficult to present in a single chart.
Created by Greta Dimitrova + Kiril Mandov | Morphcode (Sofia, Bulgaria)
Explore City Dots