by Emina | Mar 26, 2015 |
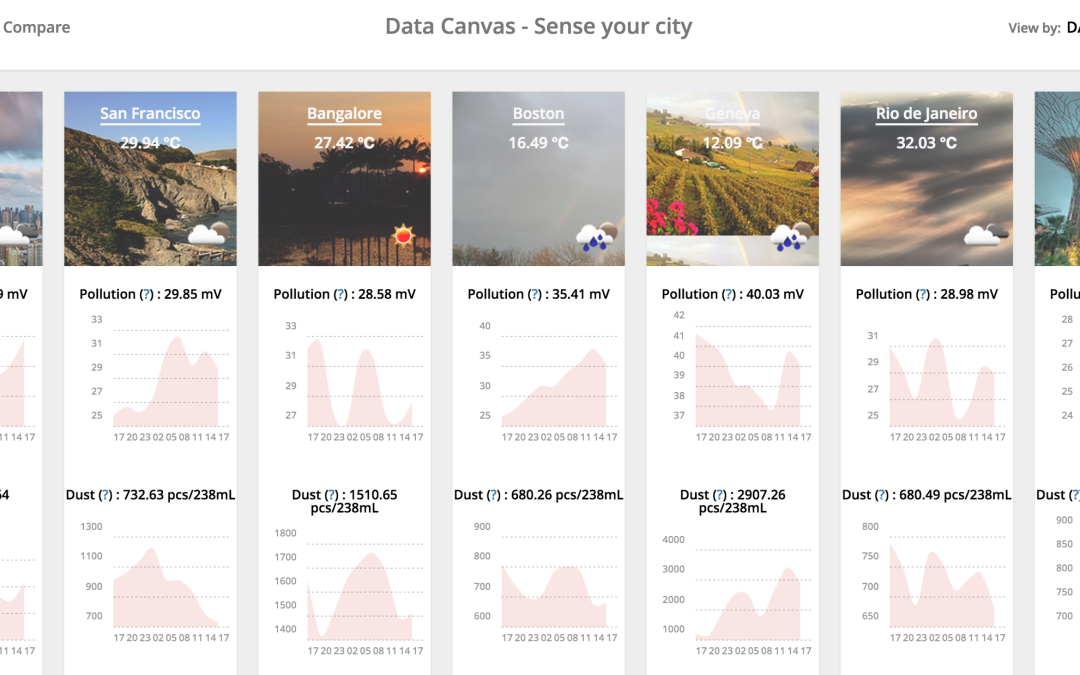
Selected for Exhibition Sensor Weather Chart is eligible for Data Canvas exhibitions that will be curated both online and offline. Project Description This project will use several resources from the Internet. First there is the sensor data from 7 cities, then the yahoo flickr weather project to provide the background image of each city, and lastly there is the overview weather from openweathermap api. With the combination of these awesome data sources, Fraser visualized the data into three different views: overall, specific, and compare. Each view presents its own aspect of the data from three different ranges (day/week/month). * The overall view provides an overview of the weather in 7 cities, and the header background of the city will change according to the weather; * The specific view provides the detailed sensor information from the selected city; * The compare view allows the viewer t0 compare the values from all cities by selecting and unselecting cities from the city list. Created by Fraser Xu (Shanghai, China) Explore Sensor Weather Chart...
by Emina | Mar 26, 2015 |
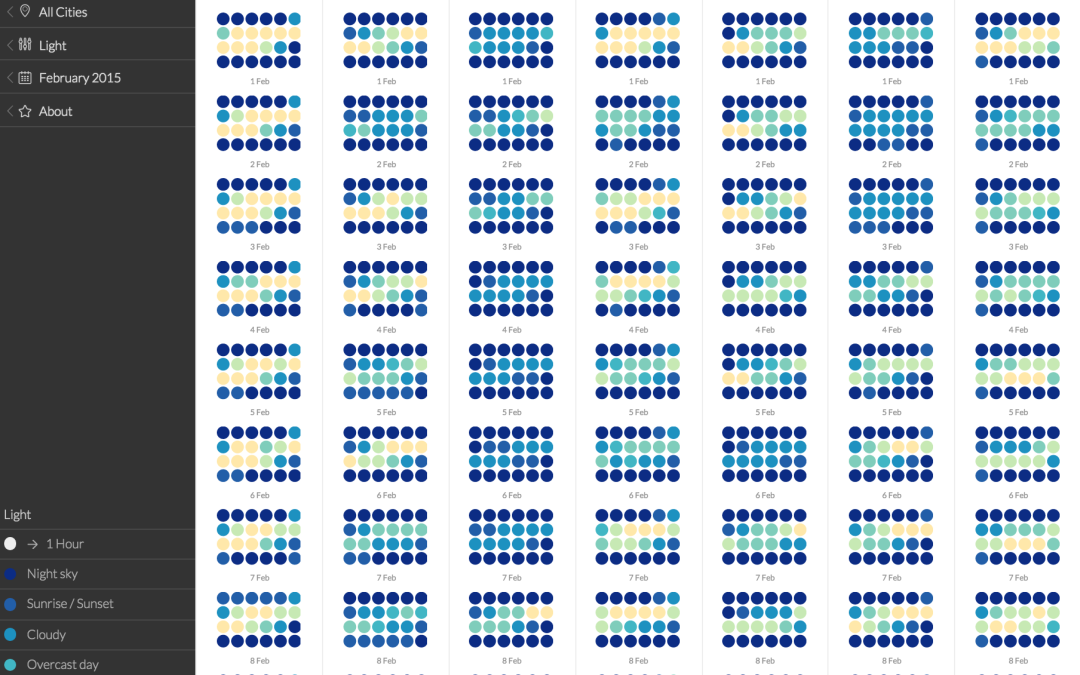
Selected for Exhibition City Dots is eligible for Data Canvas exhibitions that will be curated both online and offline. Project Description City Dots allows you to explore, compare and sense the patterns of your city. The interactive infographic visualizes data from various sensors deployed in 7 cities around the globe. The aggregated data for each city is plotted as a collection of dots at a resolution of 1 hour. Each dot represent one hour of sensor data. 24 dots represent a single day. The Dotty Small Multiples allow the comparative visual display of multivariable data that would otherwise be difficult to present in a single chart. Created by Greta Dimitrova + Kiril Mandov | Morphcode (Sofia, Bulgaria) Explore City...
by Emina | Mar 25, 2015 |
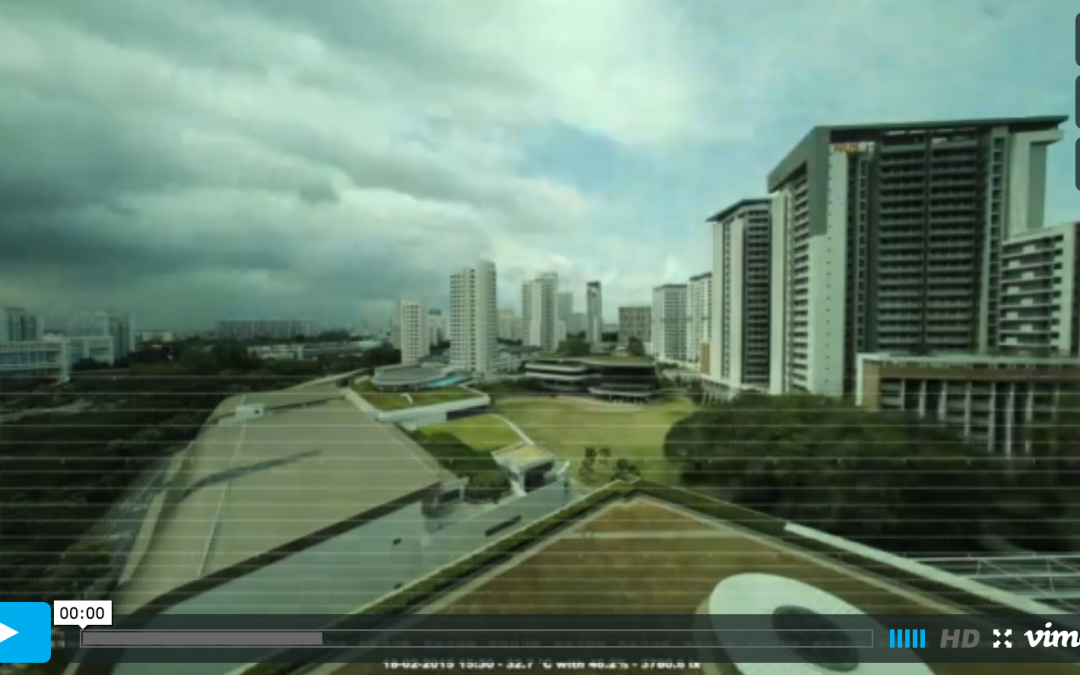
Selected for Exhibition DataCanvas Weather Timelapse is eligible for Data Canvas exhibitions that will be curated both online and offline. Project Description Lying on a greenfield, surrounded by dandelion, watching the sky. Clouds are forming, reshaping, passing by. As scientists we are wondering what causes the clouds, the rain, and all those weather-related phenomena. What if we could keep a longer observation somehow recorded, in order to study the complex interaction between several parameters as there are wind speed and direction, temperature, radiation, precipitation, pollution etc. in a scientific manner? What would be needed to do so? Data Canvas is enabling half of the answer by providing sensors for climate data and a platform to host the measurements. The missing part was our project on weather timelapse videos. A Canon EOS M equipped with a F2.8/8mm fisheye lens and customized firmware has been installed to record a timelapse video. Based on one picture per minute in variable exposure and shutter time either a 30fps or a 60fps video can be compiled. With the latest memory cards up to two weeks of observation can be captured. The camera is mounted on a tripod, has a weather-proof casing and can run independently from the user. Currently we record a 120° field of view with a single camera in 4k video resolution; in near future we have a setup of three cameras plus the weather sensor to record the full 360°. Data from the Data Canvas platform (our own team’s sensor) is now put an overlay on top of the weather timelapse video. By comparing temperature, humidity, and sunlight the scientist or...
by Emina | Mar 25, 2015 |
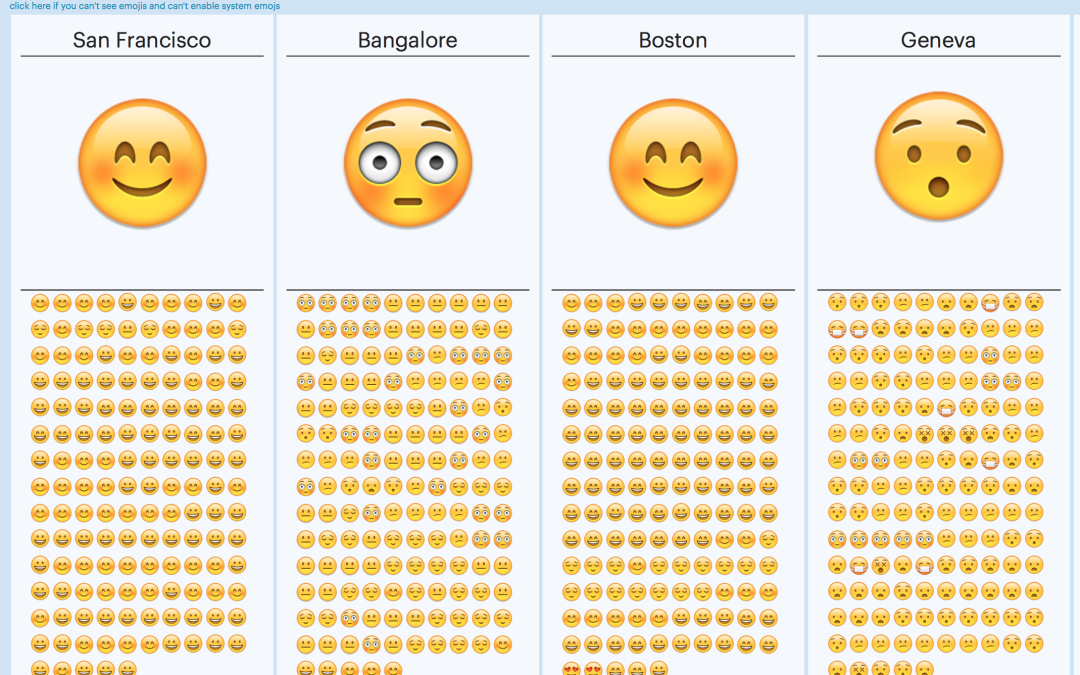
Selected for Exhibition Emojicity is eligible for Data Canvas exhibitions that will be curated both online and offline. Project Description What if your city could express itself? Created by Michael Flückiger (Zurich, Switzerland) Explore Emojicity...
by Emina | Mar 25, 2015 |
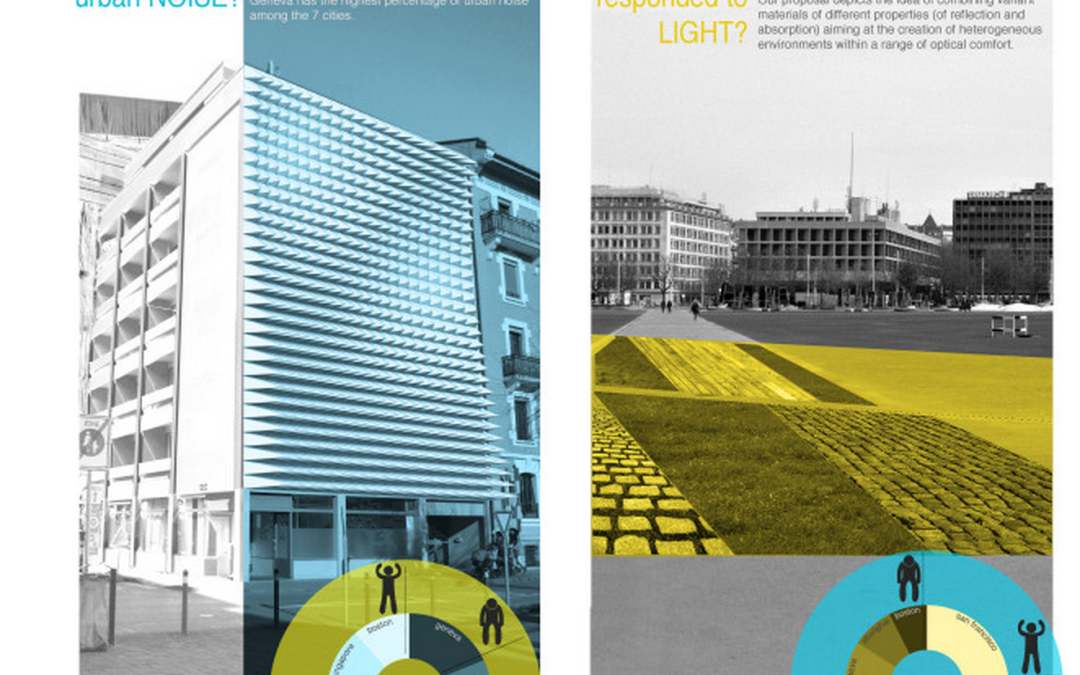
Selected for Exhibition Witness Data is eligible for Data Canvas exhibitions that will be curated both online and offline. Project Description Sense Your City acknowledges the fact that cities are more what we are seeing, observing and experiencing through our every day life. The focus is on the microclimate of the city and the invisible agents that make up the air quality, humidity, temperature, dust, light intensity etc. The sensors distributed in various cities and places of the world by the Data Canvas: Sense the City initiative, assist in revealing those agents to the public to stir awareness and engagement. Witness Data utilises the data retrieved from the sensors, and uses design as means to convey this information to the public. The creators envision a city were data will be open to the public to inform it and stir initiatives. As our project tries to illustrate data are there to inform both citizens and cities. The way we make our built environment, the orientation of our buildings, their geometry, the materials we use, the percentage of green areas and their distribution, as well as our own behaviour and habits can be questioned, informed and altered by capturing data. Created by Christina Doumpioti + Ermioni Natsi (Geneva, Switzerland) Explore Witness Data ...