Selected for Exhibition
Sensor Weather Chart is eligible for Data Canvas exhibitions that will be curated both online and offline.
Project Description
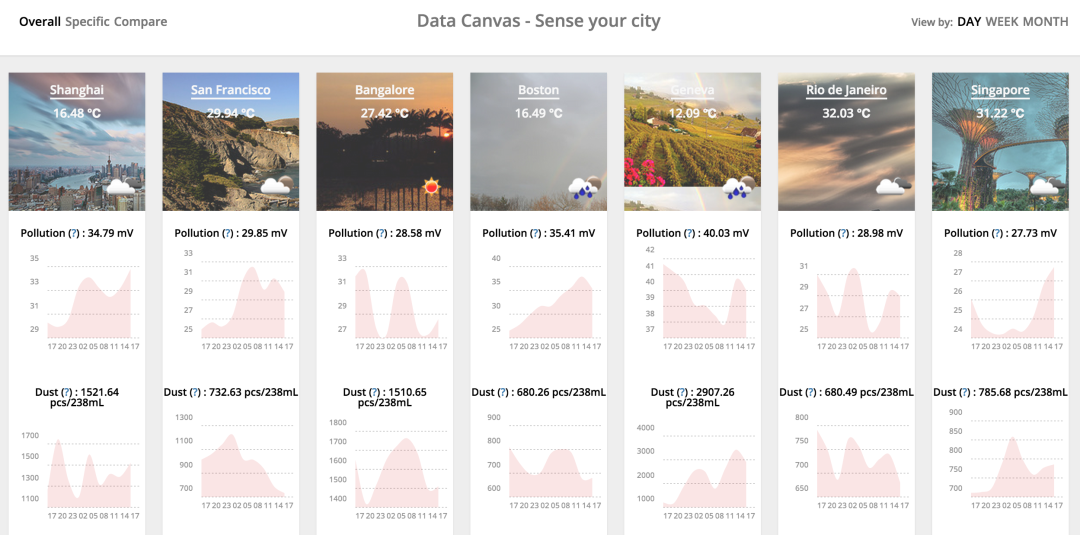
This project will use several resources from the Internet. First there is the sensor data from 7 cities, then the yahoo flickr weather project to provide the background image of each city, and lastly there is the overview weather from openweathermap api. With the combination of these awesome data sources, Fraser visualized the data into three different views: overall, specific, and compare.
Each view presents its own aspect of the data from three different ranges (day/week/month).
* The overall view provides an overview of the weather in 7 cities, and the header background of the city will change according to the weather;
* The specific view provides the detailed sensor information from the selected city;
* The compare view allows the viewer t0 compare the values from all cities by selecting and unselecting cities from the city list.
Created by Fraser Xu (Shanghai, China)
Explore Sensor Weather Chart